“Electric vehicles are much better than other cars because only they have truly zero emissions.”
“Completely wrong, think of all the stuff going on during battery production and especially the emissions of the power stations.”
“There isn’t any, I use 100% renewable energy only.”
“But you have to build up all the solar panels and wind turbines first and put that on the bill. In total, diesel is still much better.”
“Then you must include building all the oil wells, docks, ships, pipelines, refineries as well. That’s a lot.”
“No, I don’t – because they are already there.”
“But not forever, and this infrastructure can’t even be used for hydrogen to run fuel cell electric vehicles.”
“Then make that hydrogen from your renewable electricity.”
“That’s nonsense. You would need five times more electric energy than for a battery electric vehicle.”
“But fuel cell electric vehicles give you a much higher range.”
“If it’s about range, plug-in hybrids are still the best solution.”
“Certainly not. They need two drivetrains and energy infrastructures in parallel, and most of them are never driven in electric mode.”
“But the market proves that plug-in hybrids are what customers really want.”
Sounds familiar? When arguing about which mode or drivetrain may be the most sustainable and promising choice for future mobility, we see even experts comparing not only apples and oranges but all kinds of fruit and even vegetables these days …
So it is certainly worth trying to structure this and cut the sustainability elephant into clear slices. As the fictional conversation above shows: to quantify and compare costs, emissions or social impact (the three pillars of sustainability), looking solely at a vehicle’s utilization profile and powertrain technology is certainly not enough. They are off course important but only one part of the system that is to be assessed. But what are the other elements of this system? I personally recommend adding the following five aspects of the life span to the basic vehicle or service usage:
1. Vehicle Provision
As development determines the properties of the future vehicle, we primarily hold them accountable for “their” vehicle’s impact during utilization phase – especially its emissions. But the development phase itself has a direct impact too, even if comparably minor. Replacing hardware prototypes by virtual ones e.g. significantly reduces not only time and costs but also emissions; choosing less complex technical solutions (such as a battery electric vehicle instead of an internal combustion vehicle) reduces the required testing and validation including its side effects; digitalizing work processes allows both globalization and teleworking and thus adds up to social responsibility.
In the same way, the direct impact during marketing, sales and finance is certainly smaller than the one that is caused during this phase but actually happens later on: At the end of the day, it is salespersons who have the biggest leverage on customers’ decision which car they purchase or which mobility mode they select. In relation to that, the sustainability potential during the marketing, sales and finance phase itself, e.g. shifting to online sales and marketing, is comparably low.
While development, marketing and sales play only a minor role, vehicle production certainly fills each vehicle’s backpack with ecologic and social impact stemming from manufacturing and logistics processes. Here, the complete value chain from material mining to delivering the complete vehicle or service must be taken into account.
2. Energy Provision
Gasoline, diesel, e-fuels, hydrogen, electricity – every form of energy must be generated, stored, processed and distributed before it is available in the vehicle and converted in mechanical performance. And all these sections of the well-to-tank-process – i.e. electrical power generation, distribution and buffering on one side, oil or gas extraction or generation, refining, transport and storage on the other side – contribute to a vehicle’s sustainability balance.
In addition, accidents in power stations, oil rigs, tankers, pipelines or hydrogen filling stations as well as political and military conflicts over resources and energy dramatically demonstrate how well-to-tank processes do not only have a direct impact, but also bear especially ecologic and social risks.
3. Maintenance and Repair
Wear and tear require service, technical complexity and errors lead to problems that must be fixed, accidents cause damage that must be repaired. In any case, occurrence and impact of these measures depend largely on the vehicle concept and utilization mode: As electric drivetrains have dramatically less parts and cause less thermal and mechanical wear than combustion engines, their impact in service and maintenance is significantly lower. On the other side, vehicles used in mobility services show significantly higher wear, accident rates and even vandalism than privately owned vehicles.
4. End-of-life
At the end of their usable lifespan, vehicle components or complete cars are collected, analyzed and disassembled. Whether parts can be reused or recycled or must be scrapped significantly adds up to the quantitative sustainability indicators. E.g., remanufacturing engine parts or reusing degenerated EV batteries in battery second live applications help reducing the end-of life impact.
5. Infrastructure
Last but certainly not least: Infrastructure is often forgotten because it is considered “already there”. But a fair comparison of technical concepts must also include the economical, ecological and social impact of providing, maintaining and eventually removing the facilities, equipment and IT-systems required for all parts of both the provision and usage phase. In this sense, creating hydrogen from electricity by electrolysis might look emission free at first glance but a look at the impact of providing and maintaining the required plant shows a different picture. The impact of infrastructure has to be looked at over a longer period of time. Developing electric vehicles for the first time e.g., might require building up a new test facility for lithium-ion-batteries but may also make unnecessary the renewal of an existing test facility for diesel engines at a later point in time.
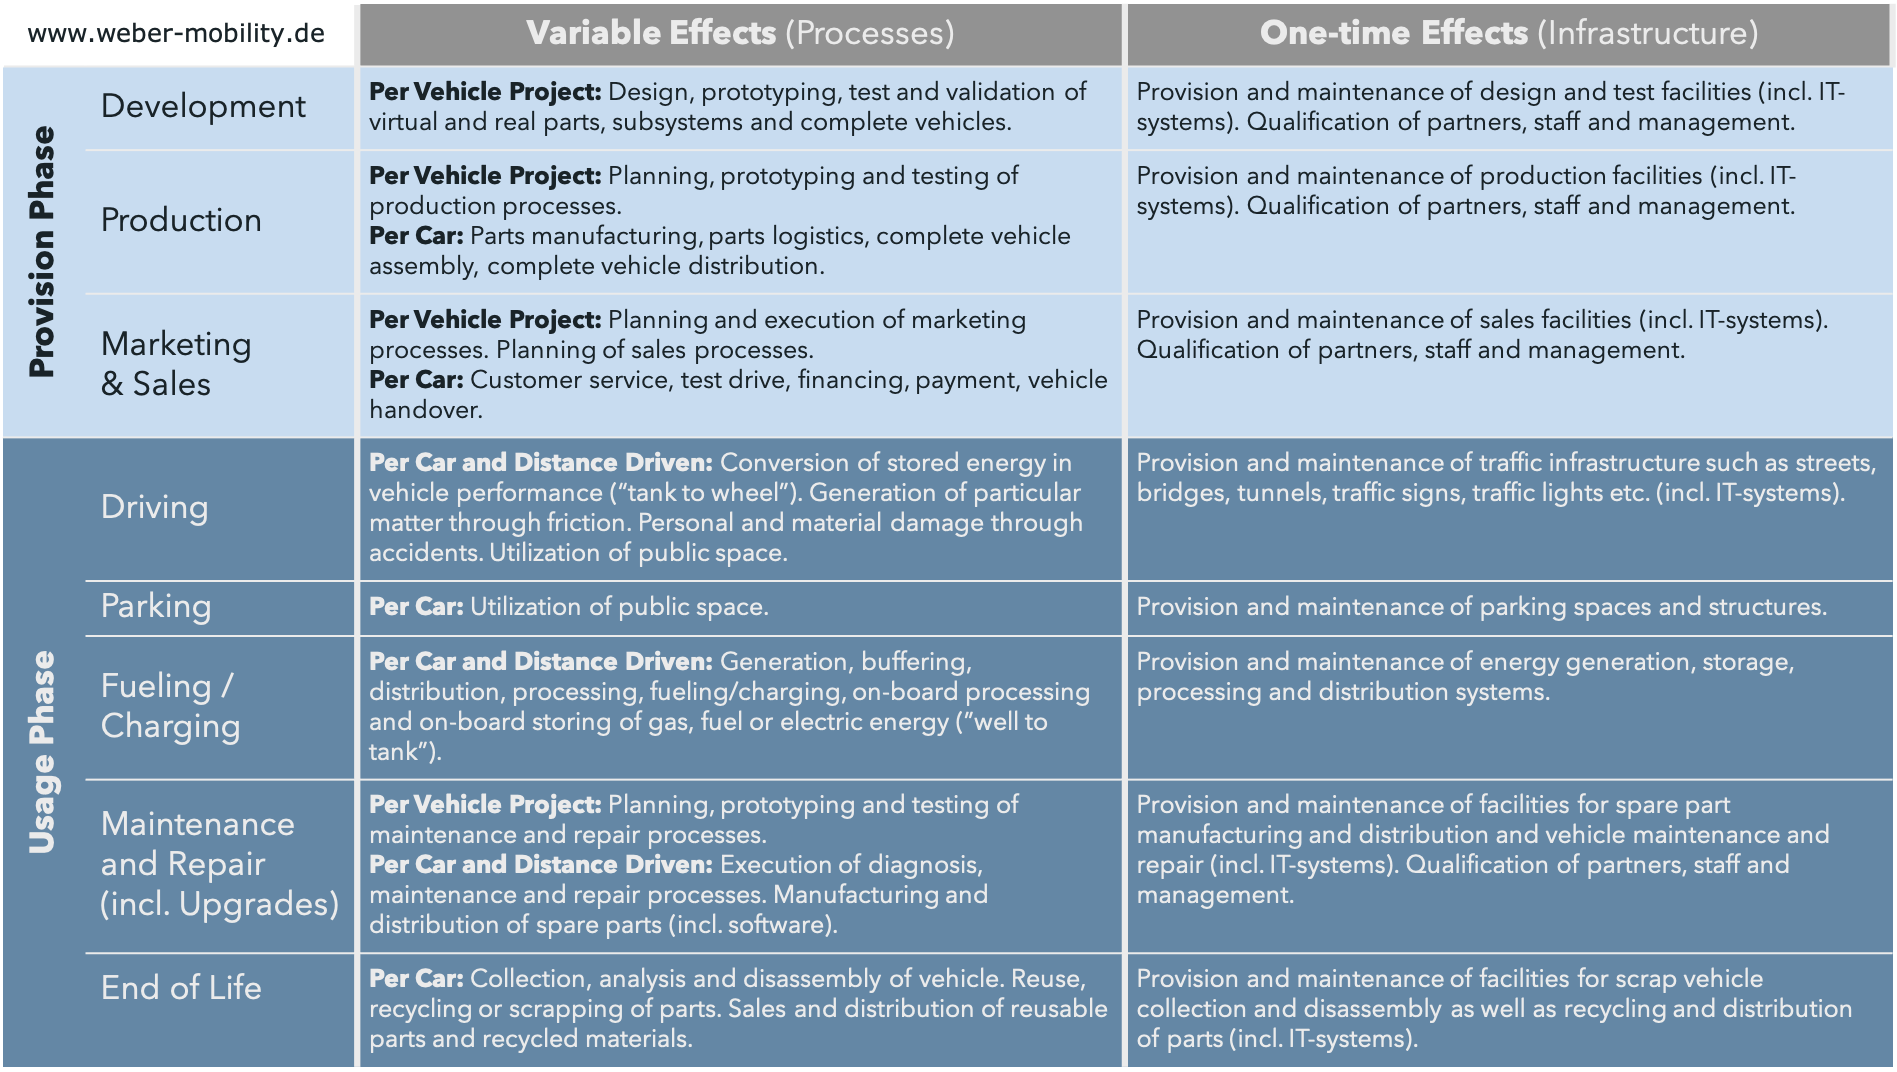
In a nutshell, this approach requires looking at both processes and infrastructure for every phase of the product or service life cycle. The table below gives a very basic overview of the emerging tree model. Eventually, extending the system boundaries in this way allows comparing apples and apples again.